The Helix research group
Research themes
Work in progress and results
Publications
Software and databases
News from Helix
Software and databases > ISee
Home page
Site map Mail to Helix
Statistical analysis of DNA sequences
 

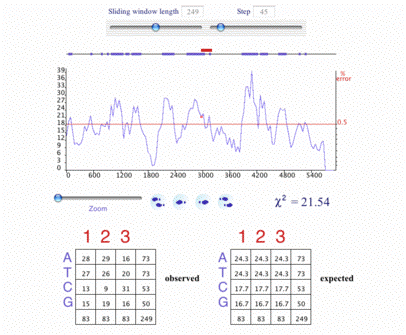
The Chi2 method - 28.9 ko
The Chi2 method

On the main chi2 visualization screen, the chi2 graph is displayed along the whole DNA sequence. Chi2 values over a given threshold are reported. The contingency tables for the current chi2 point are displayed and can be detailed on a further visualization level. The computation of the numbers of each nucleotid, expected and observed in each codon position, as well as the partial chi2 and the chi2 values is explained.
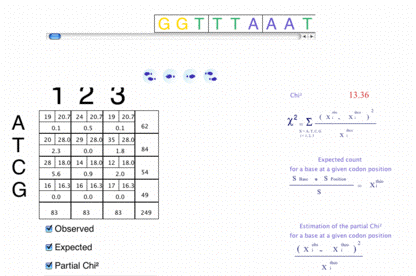
Computation of the contingency tables - 19.6 ko
Computation of the contingency tables

 
In the same section
Call for partnership
Dotplot
Gene finding strategy in bacterial sequences
How to get ISee?
Interactive lessons
Introducing the genetic code and the translation process
ISee copyright notice
Pattern matching algorithms
Sequence alignment
Statistical analysis of DNA sequences
 
    Top of page   Home page  Prepare to print