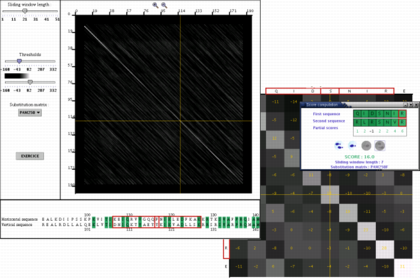
A dotplot is a synthetic view of the similarities between the regions of two sequences. The associated ISee modules allows to zoom into a part of the dotplot and to see the scores associated with each point. The computation of a score can also be made step by step.

|